
Turn a CSV into a sales report
In this example you start from a CSV export of your sales, turn it into a data table, and ask the Artifact Generator to build a report from it. The result is a page you can open, share and refine in the chat.
You need:
- A CSV file with one row per sale, for example with a date, a product, a
quantity and an amount. The example uses
sales_20261016_37c645.csv. - A knowledge base you can edit. See Create a knowledge base.
1. Upload the CSV to a knowledge base
Section titled “1. Upload the CSV to a knowledge base”-
Open Knowledge from the left rail and open your knowledge base.
-
In the Files tab, drag and drop the CSV file.
The file now appears in the list of files.
2. Import the CSV into a data table
Section titled “2. Import the CSV into a data table”A CSV file uploaded as a document is only searched as text. To let agents filter, group and sum its rows, import it into a data table.
-
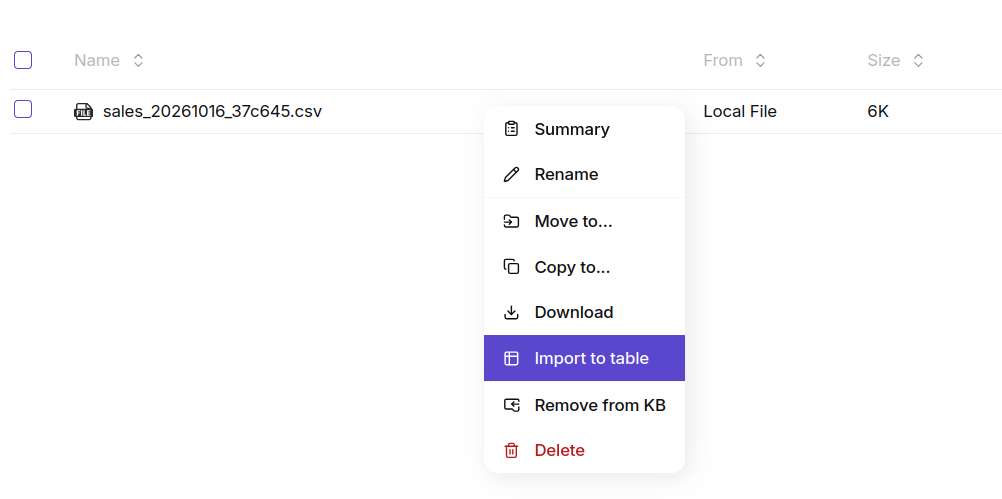
In the Files tab, open the actions menu of the CSV file and choose Import to table.
-
Keep Datatable and New selected, and pick the knowledge base that will hold the table.
-
Click Import.
Nebulas infers the table’s columns from the file, so there is nothing to
define by hand. The table appears in the Tables tab of the knowledge base.
Its name is the one you’ll use in the chat, here sales_20261016_37c645.
3. Add the knowledge base to your workspace
Section titled “3. Add the knowledge base to your workspace”An assistant can only use the knowledge bases of the workspace you chat in.
-
Open My Workspace.
-
In the Knowledge section of the sidebar, click Edit Knowledge.
-
Select the knowledge base that holds the table, and confirm.
The knowledge base, and the sales_20261016_37c645 table inside it, now show
in the Knowledge section of the workspace.
4. Ask the Artifact Generator for the report
Section titled “4. Ask the Artifact Generator for the report”In the chat of My Workspace, type @, pick Artifact Generator, and send:
@Artifact_GeneratorUsing the table sales_20261016_37c645 can you create a report containing the monthly sales of each productThe Artifact Generator reads the table, computes the monthly totals per product, and writes the report as a page. You can follow its steps while it works. When it’s done, the answer links to the generated report.
From there you can open the report, share it by link, or add it to a knowledge base so others can find it.
5. Refine the report
Section titled “5. Refine the report”The conversation stays with the Artifact Generator, so follow-up messages edit the same report instead of starting a new one. For example:
Add a line chart of the monthly total, and sort the products by total sales.Only keep 2026, and add a column with the change versus the previous month.